【Dv Power】頻率響應特性曲線的基本認識

The frequency response analysis is a powerful tool used to check the mechanical and electrical integrity of power transformers. Short-circuit faults in the power system or potentially high acceleration created during transportation can cause severe deformations of the transformer windings and mechanical construction, due to strong electrodynamic force. Similar problems may also appear during installation, seismic occurrences, or inrush current. It is a useful tool for the acceptance test, commissioning, relocation, post fault, and manufacturing testing of power transformers.
The equivalent circuit of the power transformers consists of the resistance, inductance, and capacitances as well between turns, between winding and the tank, and the core. FRA is a function of the RLC network related to the physical geometry and presents a unique characteristic of each transformer.
Any deformation of the transformer’s mechanical construction will cause a change in the RLC structure which in turn will affect the frequency response. Measuring the frequency response in a wide frequency range will enable detection of the defects in the windings and magnetic core of power transformers.
Mechanical or electrical changes of a transformer are detected by comparing their frequency response measurement fingerprints. This comparison can be used to detect power transformer problems such as:
- Shorted turns or open windings;
- Winding displacement or deformations;
- Coil deformation – axial and radial;
- Core movements/deformation;
- Faulty core grounds;
- Winding connection problems;
- Magnetized core;
- Broken clamping structures.
Frequency Response Measurement Circuit
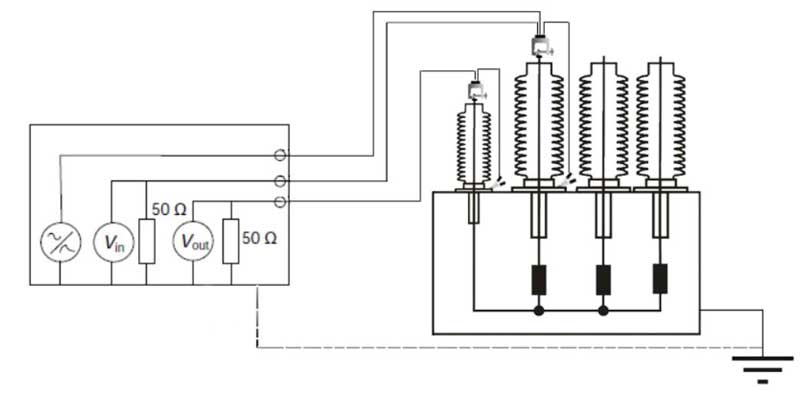
To make a frequency response measurement, a low voltage signal is applied to one terminal of the test object with respect to the tank. The voltage measured at this input terminal is used as the reference signal and a second voltage signal (the response signal) is measured at a second terminal with respect to the tank. The frequency response amplitude is the scalar ratio between the response signal (Vout) and the reference voltage (Vin) (presented in dB) as a function of the frequency. The phase of the frequency response is the phase difference between Vin and Vout (presented in degrees).
As Vout/Vin varies over a wide range, it is expressed in decibels (dB). The relative voltage response in dB is calculated as 20 × log10(Vout/Vin), where (Vout/Vin) is the scalar ratio.
The response voltage measurement is made across an impedance of 50 Ω. Any coaxial lead connected between the test object terminal and the voltage measuring instrument shall have a matched impedance. To make an accurate ratio measurement, the technical parameters of the reference and response channels of the measuring instrument and any measurement leads shall be identical.
The characteristic impedance of the coaxial measuring leads is chosen to match the measuring channel input impedance to minimize signal reflections and reduce the influence of the coaxial lead on the measurement to the point where it has little or no practical effect on the measurement within the measurement frequency range.
With a matched impedance lead, the measuring impedance is effectively applied at the test object terminal.
An example of the general layout of the measurement method using coaxial measuring leads is shown in the following figure:

Schematic of the frequency response measurement circuit
Understanding of Frequency Response Characteristic
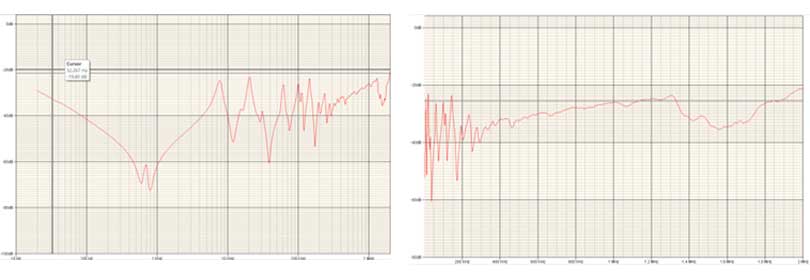
Although both, the amplitude and phase of the voltage ratio are recorded during frequency response measurements, generally only the amplitude information is presented and used for visual interpretation of the results. The frequency response can be displayed on either a logarithmic or a linear scale as shown in Figure 2 and Figure 3. Each method has advantages but generally, a logarithmic scale plot offers easy overall response trend analysis while a linear scale plot is useful for looking at discrete frequency bands and to compare small differences at particular frequencies.
Figure 2: Logarithmic scale – Amplitude Figure 3: Linear scale – Amplitude
Frequency Response of a power transformer’s windings consists of decreasing and increasing magnitude (in dB) with respect to frequency. The various resonances (maxima) and anti-resonances (minima) are determined by the electrical characteristics of the transformer winding.
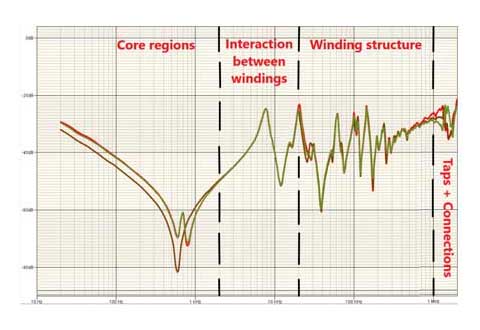
The frequency response signal can be divided into four regions of the interest for the analysis, the lower frequency region dominated by the core, the second region dominated by the interactions between the windings, the third region controlled by the individual winding structure, and fourth region controlled by internal connections, taps, and the measurement connection leads.
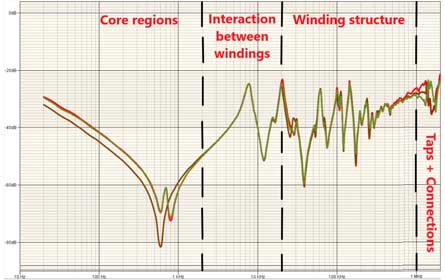
These regions are illustrated using a frequency response (end to end open circuit test) of the three phases on HV side of power transformer as an example in Figure 4.

Figure 4: Frequency response characteristic
Region 1 – Core Effect
In the core influence region (up to about 2 kHz), the response is dominated by the core magnetizing inductances and the bulk capacitances of the transformer (capacitance between windings and ground), and the end-to-end FRA response follows a falling magnitude trend across the frequency range with a linearly decreasing slope of approximately –20 dB per decade.
Power transformers with higher voltage and larger power rating usually have larger negative response magnitudes at low frequencies.
Effectively two inductance components affecting the frequency response; one is the core magnetizing inductance (affects the FRA response in the lower frequency region up to ~100 Hz), and the other is the leakage inductance of the winding (affects the FRA response in higher frequencies).
For three-phase three limb core-form power transformers, the middle phase would have a single anti-resonance in this frequency region due to the symmetrical magnetic reluctance paths seen by the middle phase of the core through the other two phases. The outer phases generally have two anti-resonances since they experience two different magnetic reluctance paths one through the nearest (middle) phase and one through the furthest phase (the other outer phase).
Region 2 – Interaction Between Windings
The response in the intermediate frequency region (in between 2 kHz and 20 kHz) is mostly affected by the interaction between windings, which depends significantly on the arrangement and connections of the windings, for example, delta connection, auto-transformer winding connection, single-phase or three-phase transformer configurations, as well as how the neutrals are connected.
Region 3 – Effect of Winding Structure
In the winding structure influence (high frequency) region (in between 20 kHz and 1 MHz), the response is determined by the winding leakage inductances together with the winding series and ground capacitances.
In this region, the series capacitance is the most influential factor in determining the shape of the response. Typically, the response of the HV winding of large power transformers with a high winding series capacitance shows a generic rising amplitude trend with few resonances and anti-resonances as shown in Figure 4. On the other hand, the LV winding with low series capacitance generally shows a flat amplitude trend and superimposed by a series of anti-resonances and resonances.
At high frequencies, a transformer winding behaves as a capacitive element, and the end-to-end FRA response follows a rising magnitude trend across the frequency range with a linearly increasing slope of approximately 20 dB per decade. A higher capacitance causes the magnitude to increase. Power transformers having both higher voltage and larger power rating usually have smaller negative response magnitudes at high frequencies.
Inductance and capacitance in parallel will produce parallel anti-resonance at a certain frequency, blocking the signal at that particular frequency. This consequently produces a local anti-resonance in the magnitude response at that, particularly frequency.
Region 4 – Effect of Leads of Taps and Earthing Leads
At the highest frequencies of above 1 MHz, the response is less repeatable and it is influenced by the measurement set-up, tap leads, especially by the earthing connections, which effectively rely on the length of the bushing.


